Interactive console
The interactive console is a full-screen terminal interface built into stalwart-cli. It covers the same ground as the WebUI administration interface: browsing and editing accounts, domains and every other configuration object, watching the dashboard, following live traces and running actions. It suits an administrator who works over SSH, or on a host where opening a browser is impractical, and who still wants to explore the configuration rather than type one command per object.
Like the rest of the CLI, the console is schema-driven. Its navigation, list columns, forms, field help, actions and dashboards all come from the schema the server publishes, so it shows the same screens as the WebUI of the same server version and gains new objects without being updated.
Start the console
Section titled “Start the console”Running stalwart-cli with no arguments in a terminal opens the console. The tui subcommand opens it explicitly and accepts two options of its own:
stalwart-cli --url https://mail.example.comstalwart-cli tui --url https://mail.example.com --theme light --sidebar auto--theme selects the colour palette (dark, light, ansi16 or mono) and --sidebar selects whether the navigation sidebar stays visible (always) or hides until it is needed (auto). Both are described under Themes and preferences. The global options, such as --url, --insecure and --debug, work as they do for every other command (Connecting to a server).
The console needs a terminal on both standard input and standard output. Without one, stalwart-cli with no arguments prints its help instead, so scripts that call it by mistake do not hang, and stalwart-cli tui fails with the interactive console needs a terminal on stdin and stdout. In a container, the terminal has to be allocated with -it:
docker run --rm -it \ -v stalwart-cli-data:/home/nonroot/.local/share \ -e STALWART_URL=https://mail.example.com \ ghcr.io/stalwartlabs/cli tuiThe volume keeps the stored sign-in across runs, as explained on the overview page.
Sign in
Section titled “Sign in”The console opens on a sign-in screen with two fields, the server URL and the account name. --url fills in the first, and --user the second. When the command line already carries a complete credential, an API key with --api-key or a user name and password with --user and --password, the console signs in straight away and skips the screen.
Otherwise, the console reuses a stored sign-in for the server when one exists, and asks the server how its accounts sign in when none does. A server that supports the OAuth device authorization flow gets a device code: the console shows a verification URL and a short code, and the administrator opens the URL in any browser, on the same machine or another one, enters the code and approves the request. Pressing o opens the URL in the local browser and c copies the code. The console waits for the approval and then stores the session, so the next start, of the console or of any CLI command against the same server, signs in without asking again.
Only a code shown by the console itself should ever be approved. A code received from someone else would grant that person access to the account.
The console falls back to a password form, which signs in with HTTP Basic authentication, in the cases where a device code cannot be used: the server runs in recovery mode, has no device authorization endpoint, refuses to register the CLI as an OAuth client, or delegates the account to an external identity provider for which no --client-id was given. The form names the reason. A password used this way is sent with every request and never written to disk. An account protected by two-factor authentication cannot sign in with a password alone; it needs the device code, an app password or an API key.
--auth basic skips the device code and goes straight to the password form, and --auth device refuses to fall back to it. As with the other commands, --api-key and --user cannot be combined. Device sign-in on the overview page explains client registration and the --client-id option.
Once signed in, A switches between the accounts the credential can act for, such as shared accounts, and L signs out. Signing out revokes the stored session on the server and deletes it locally, exactly like stalwart-cli logout. When a session expires, the console returns to the sign-in screen and, after a new sign-in, reopens the view that was showing.
Screen layout
Section titled “Screen layout”After sign-in, the console opens the view visited last, or the dashboard on first use:
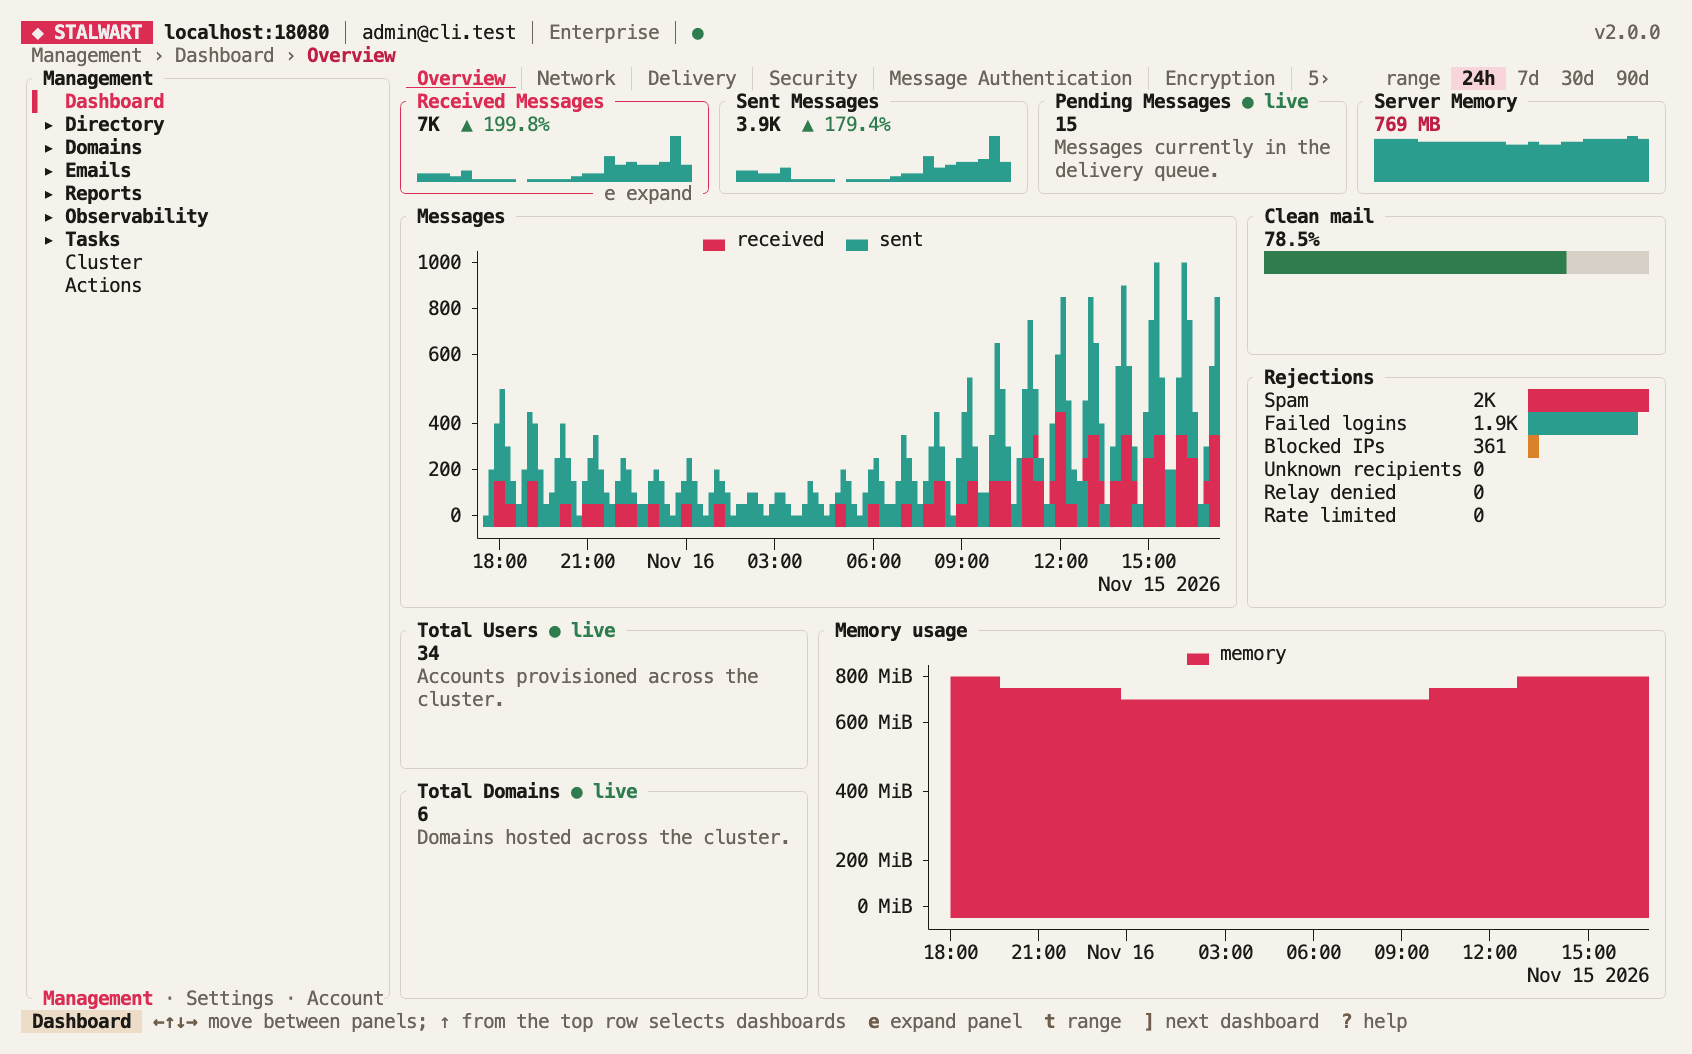
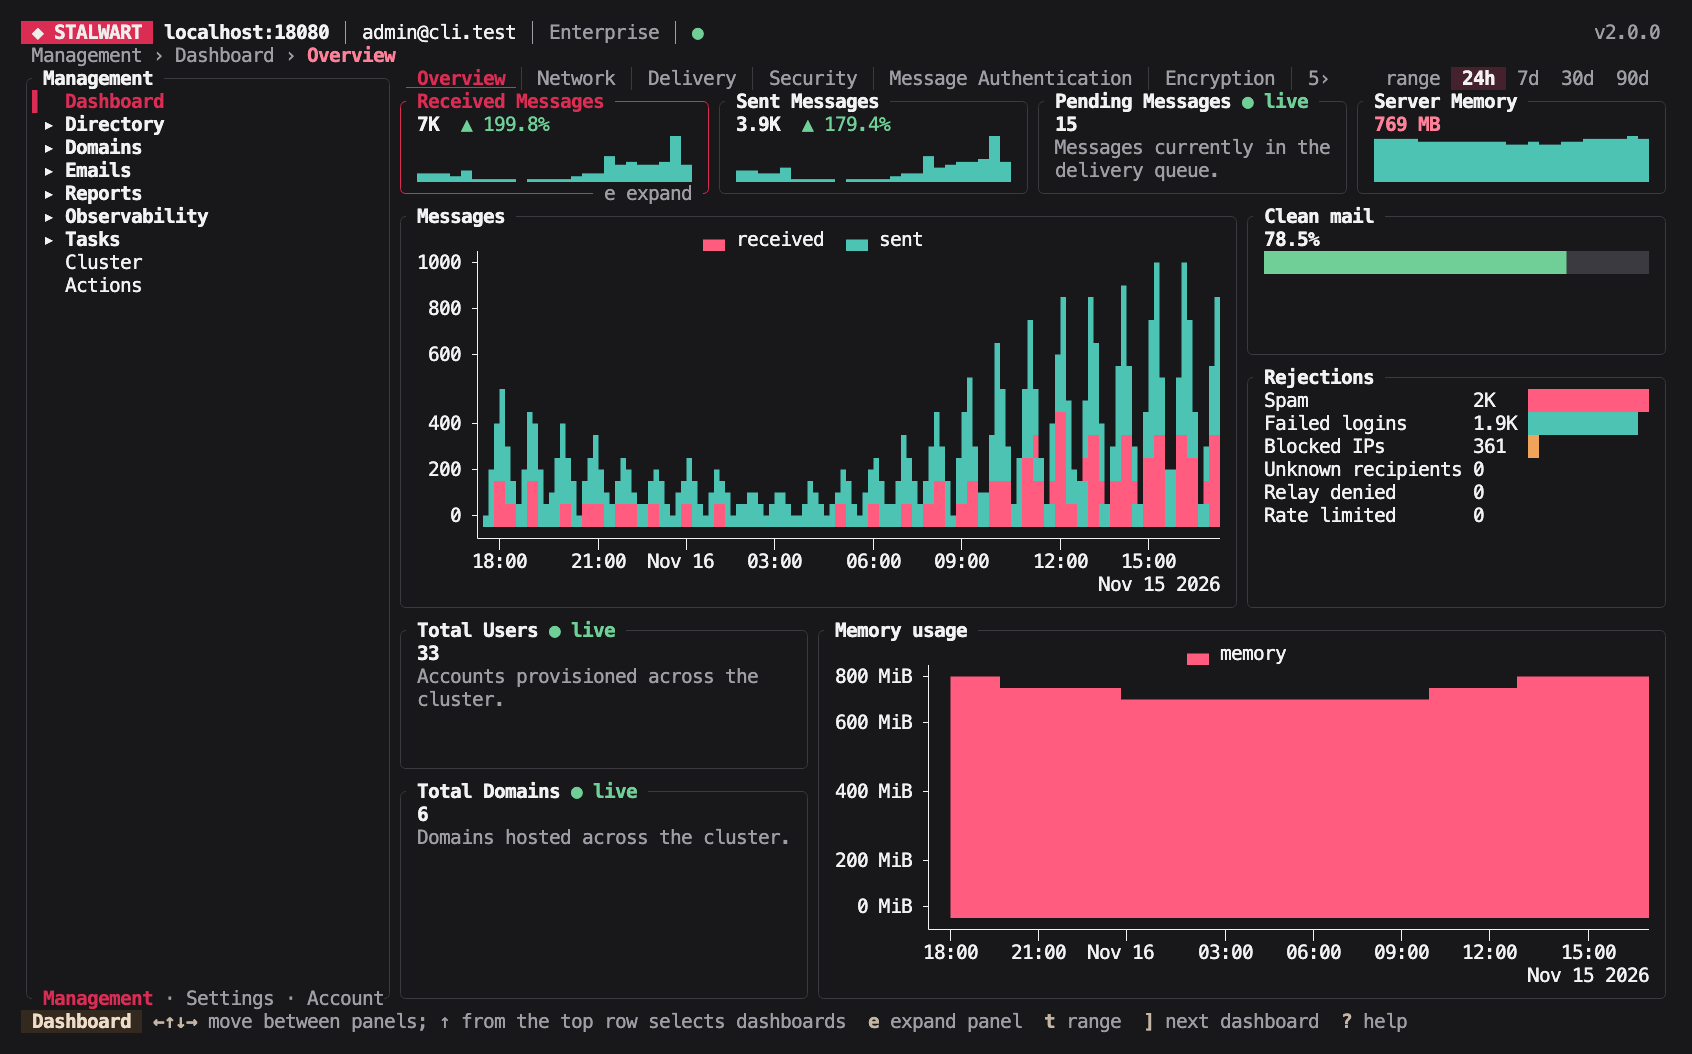
The screen has four parts:
- Header: the server, the signed-in account, the server edition and version, and a health indicator that turns yellow while a live stream reconnects and red when the server cannot be reached. A second line shows the path to the current view.
- Sidebar: the navigation tree, organised into the same layouts as the WebUI, which are currently Management, Settings and Account. The left arrow at the left edge of a view moves the focus to the sidebar, and
]and[switch between layouts while it has focus. - Content: the current view.
- Footer: the name of the current view, the most useful keys for it, and short status messages such as the result of a save.
The sidebar only lists views the account may use. A view is hidden when the account lacks the permission to read its object, and the views of standard JMAP objects (mailboxes, calendars, address books, Sieve scripts and the vacation response) are hidden when the selected account lacks the matching JMAP capability. On a Community edition server, Enterprise features stay in the sidebar, dimmed, and open a page describing the Enterprise edition.
The fastest way to move around is the jump palette, opened with :. It searches, by fuzzy match, every view in the sidebar, every object, and every form section and field label, so typing dkim or relay host leads straight to the screen that holds the setting. The palette also lists console commands, such as switching account, changing the theme and opening the plan tools. Esc goes back to the previous view, and ? shows every key available on the current screen.
Objects
Section titled “Objects”Every object type with more than one instance opens as a list, with the columns the schema defines for it. The list loads rows page by page as the cursor moves, so even types with many thousands of objects open immediately; the title shows the total number of objects.
Enter opens the object under the cursor and n creates a new one. / opens the filter bar, which offers the filters the schema defines for the type: text fields, numbers and dates (where Ctrl+O cycles through =, >=, >, <= and <), and enumerations and references, which open a picker. o cycles the sort order through the sortable columns, ascending and then descending.
x opens the actions of the current object. Besides opening and deleting it, these include the actions the schema defines for the type, which set a property of the object or open a list of related objects.
Bulk operations
Section titled “Bulk operations”Several objects can be marked and then acted on together. Space marks the current row, v marks every row on the visible page, and * marks every object that matches the current filter, including those not loaded yet. With objects marked, d deletes them and x offers the bulk actions the schema defines for the type.
A bulk operation is sent in batches of the size the server allows per request, and the status line reports its progress batch by batch. Esc cancels it after the batch in progress. When it finishes, a summary lists the objects that failed and the reason given by the server.
Opening an object shows its form, with the same sections, field labels and field help as the WebUI. On a terminal at least 110 columns wide, the sections are listed on the left and the help text of the current field on the right; on a narrower terminal the help appears below the form. Each field has an editor suited to its type: sizes and durations have a unit, enumerations and references open a searchable picker, lists and maps can be extended and reordered, and secrets stay masked unless revealed with Ctrl+R.
Nothing is sent to the server while editing. Ctrl+S opens a review of the changes, which lists every changed field and, with Tab, the exact JMAP request that will be sent. The changes are saved only when confirmed with an upper-case Y. If the server rejects the change, the errors are shown next to the affected fields.
E opens the whole object as JSON in the editor named by VISUAL or EDITOR (or vi), and loads the result back into the form when the editor exits. This suits changes that are easier to make as text, such as long lists of addresses, and the review step still applies before anything is saved.
An account that may read an object but not change it sees a read-only view instead of the form.
Confirmations
Section titled “Confirmations”Every operation that changes or deletes data asks for confirmation with an upper-case Y, so a stray key press never deletes anything. The confirmation is marked as high risk for deletions and for changes that switch an object to another variant, and it shows the objects affected and the request that will be sent.
Dashboard
Section titled “Dashboard”The dashboard shows the same panels as the WebUI dashboard, drawn with terminal graphics: counters with their trend and a sparkline, line and area charts, ratios and rankings. It reads the metrics the server records in its telemetry history, so history has to be enabled for the charts to show anything. Panels marked live, such as the number of pending messages, are updated every 30 seconds through the live metrics stream, and opening the dashboard requires the liveMetrics permission.
The server defines several dashboards, shown as tabs along the top and switched with ] and [. t cycles the time range through the last 24 hours, 7 days, 30 days and 90 days, and T asks for a custom range in UTC, written as two dates such as 2026-11-01 2026-11-15. On a cluster, n restricts the panels to one node. The arrow keys move between panels, e expands the selected panel to fill the screen, f freezes the live panels and r reloads the data.
The selected range is remembered for the next session.
Live tracing and delivery tests
Section titled “Live tracing and delivery tests”Live tracing streams the server’s events as they happen, like the live log of the WebUI. It requires the liveTracing permission and the Enterprise edition. Before starting the stream, the administrator can enter keywords and filters on event fields, such as an account name or a status code, to follow a single session while a problem is reproduced. The console keeps the most recent 1,000 events and follows the newest unless scrolled back; G returns to following.
The delivery test traces the delivery of a message to an address or domain, step by step, without sending anything. It runs the same test as the WebUI, which Troubleshooting describes, and requires the liveDeliveryTest permission. Each step appears as it completes, and d shows the details of each result.
The inbound and outbound delivery history views, also an Enterprise feature, list the delivery traces stored in the telemetry history; opening one shows its events on a timeline.
Actions
Section titled “Actions”The Actions view lists the operations the server can perform on demand, such as reloading the TLS certificates, pausing the MTA queue or invalidating caches, grouped by category. Actions without parameters run after a confirmation, and the others first open a small form. Running actions requires permission to create Action objects; Actions describes them.
Plans and snapshots
Section titled “Plans and snapshots”The plan tools, opened from the jump palette with “Tools”, run apply and snapshot without leaving the console. Applying a plan takes the path of the plan file, whether to make a dry run or apply it, and whether to stop at the first failed operation. A snapshot takes the object types to export, the output file and whether to include secrets. The report appears as the tool runs, and c cancels it before its next request to the server.
The tools offer the options that matter interactively. The full set of options, such as JSON output or unresolved references in a snapshot, is available from the commands themselves.
Setup wizard
Section titled “Setup wizard”When the console signs in to a server in bootstrap mode, it opens the setup wizard instead of the dashboard. The wizard walks through the same pages as the WebUI wizard, one per section, and validates every page before saving. Its last page shows the credentials of the generated administrator account. These are shown only once, so they must be recorded before leaving the page. The server then has to be restarted, after which l returns to the sign-in screen.
Themes and preferences
Section titled “Themes and preferences”The console has four palettes:
darkandlight: full-colour palettes, for terminals that support 24-bit colour.ansi16: the terminal’s own 16 colours, which follow the terminal’s colour scheme.mono: no colour, only bold and reverse video.
On first start, the console picks dark when the COLORTERM environment variable reports 24-bit colour and ansi16 otherwise. Ctrl+T cycles through the palettes and s switches the sidebar between always visible and hidden until needed; a hidden sidebar reappears when the left arrow moves the focus to it. Both choices are saved, while --theme and --sidebar apply to one run only. --no-color, a non-empty NO_COLOR variable or TERM=dumb force mono regardless of the saved choice.
The preferences, which include the palette, the sidebar mode, the last view of each layout and the dashboard time range, are saved in a tui.json file:
- Linux:
~/.config/stalwart-cli/tui.json - macOS:
~/Library/Application Support/stalwart-cli/tui.json - Windows:
%APPDATA%\stalwart-cli\tui.json
Deleting the file restores the defaults.
Keyboard reference
Section titled “Keyboard reference”Arrow keys and the Vim keys h, j, k and l both move the cursor everywhere. In a text field, letters are typed rather than interpreted as commands, so only Esc, Enter and the Ctrl combinations act there. Ctrl+C always quits.
The following keys work on every screen:
| Key | Action |
|---|---|
: | Open the jump palette |
? | Show the keys of the current screen |
Esc, Backspace | Close the topmost dialog, or go back |
R | Reload the current view |
← (at the left edge) | Move the focus to the sidebar |
s | Switch the sidebar between always visible and auto-hide |
Ctrl+T | Cycle the colour palette |
A | Switch account |
L | Sign out |
@ | Show the HTTP log (requires --debug) |
q, Ctrl+C | Quit |
In a list:
| Key | Action |
|---|---|
Enter | Open the object |
n | Create an object |
d, Delete | Delete the current or marked objects |
/ | Filter |
o | Change the sort order |
x | Show the actions of the current or marked objects |
Space | Mark the current object and move down |
v | Mark the visible page |
* | Mark every object that matches the filter |
g, G | Go to the first or last object |
PgUp, PgDn | Move one page |
In a form:
| Key | Action |
|---|---|
Enter | Edit the field, or open a nested object |
Tab, Shift+Tab | Go to the next or previous section |
Space | Toggle a yes/no field |
u | Revert the field to its saved value |
x | Clear the field |
a | Add an item to a list |
J, K | Move a list item down or up |
t | Set a date field to the current time |
Ctrl+S | Review and save the changes |
E | Edit the object as JSON in an external editor |
d | Delete the object |
On the dashboard:
| Key | Action |
|---|---|
], [ | Show the next or previous dashboard |
t | Cycle the time range |
T | Enter a custom time range |
n | Restrict the panels to one cluster node |
e, Enter | Expand the selected panel |
f | Freeze or resume the live panels |
r | Reload the data |
? lists the keys of the other screens, such as live tracing, the delivery test and the setup wizard.
Limitations
Section titled “Limitations”The console is driven entirely by the keyboard; it does not use the mouse. Copying a value to the clipboard relies on the OSC 52 escape sequence, which some terminals disable and which terminal multiplexers such as tmux have to be configured to pass through.
A few operations remain in the WebUI. Passkeys can only be registered from a browser, because registration needs the browser’s WebAuthn support; the console shows the address of the WebUI instead. A schema view that the console cannot draw yet shows a message naming it.
The HTTP log, opened with @, records requests only when the console was started with --debug. It is the first place to look when the console reports an error from the server, because it shows the server’s own response.